Between July 27 and September 10, 2025, Aroldis Chapman made 17 consecutive appearances for the Red Sox without allowing a single hit. Seventeen outings. Zero hits. Four walks total. His full-season ERA finished at a sparkling 1.17, but the number that captured what Chapman was doing on a per-inning basis? His 0.70 WHIP, the best mark of any qualified pitcher in baseball.
Most broadcasts flash a pitcher’s ERA and move on. If you’ve ever felt like a player's ERA isn't telling the whole story, WHIP in baseball is the stat that fills the gap.
What WHIP Tells You That ERA Doesn’t
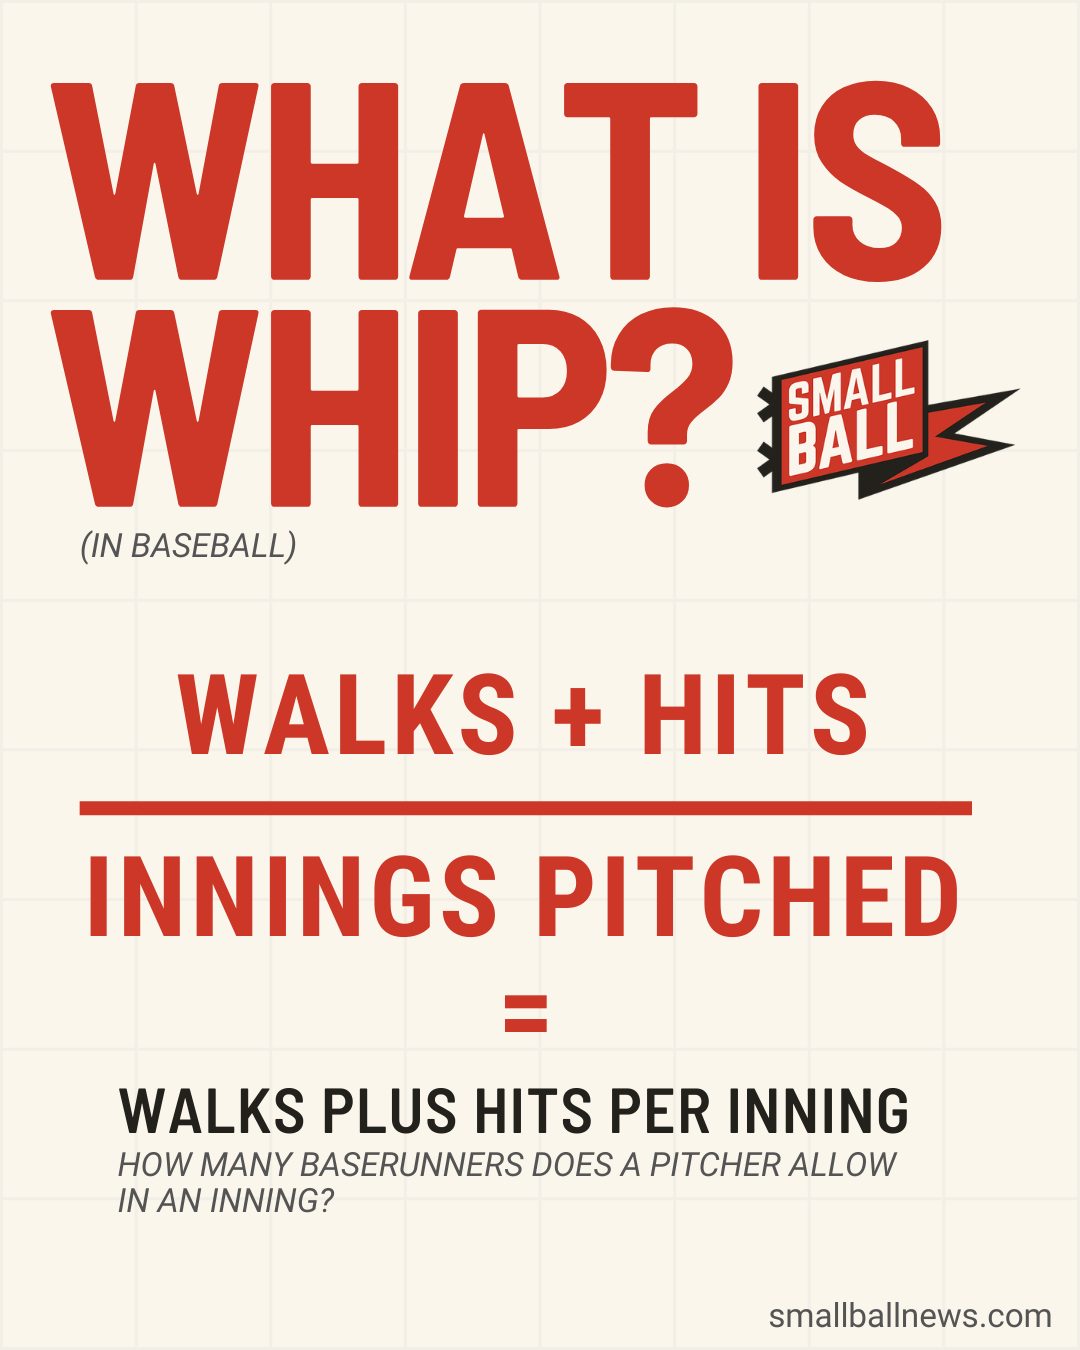
WHIP stands for Walks plus Hits per Inning Pitched. It counts every baserunner a pitcher allows through walks and hits, then divides by innings pitched. Lower is better.
Where ERA only cares about runs that actually cross the plate, WHIP tracks traffic. A pitcher who loads the bases every inning but escapes without damage will carry a clean ERA and a bloated WHIP. That gap is a problem waiting to happen. ERA tells you how many runs scored. WHIP tells you how much danger a pitcher creates every time out.
The Math (It’s Simple)
WHIP = (Walks + Hits) / Innings Pitched
Tarik Skubal led all qualified starters during his 2025 Cy Young season with the Tigers. Across 195.1 innings, he allowed just 174 combined hits and walks:
(174 / 195.1) = 0.89
Fewer than one baserunner per inning. League average WHIP in 2025 was 1.29 (per Baseball Reference), so the typical pitcher puts roughly 1.3 runners on every inning. Skubal was at 0.89. Over a full nine-inning game, that gap translates to three or four extra baserunners for the average pitcher compared to Skubal. Three or four more chances for something to go wrong.
What Is a Good WHIP in Baseball?
The scale is tighter than most fans expect. About four-tenths separates elite from average, but those four-tenths translate to real baserunners, real pitch counts, real pressure every inning.
| WHIP | What It Means | 2025 Examples |
|---|---|---|
| Under 0.95 | Elite, Cy Young territory | Tarik Skubal (0.89), Bryan Woo (0.93) |
| 0.95-1.05 | Excellent, frontline starter | Paul Skenes (0.95), Nick Pivetta (0.99), Garrett Crochet (1.03) |
| 1.05-1.20 | Above average, quality arm | Solid mid-rotation starters |
| 1.20-1.30 | League average | Where most starters land (1.29 avg) |
| 1.30-1.45 | Below average | Baserunner traffic every inning |
| Above 1.45 | Struggling | Too many free passes and hard contact |
Bryan Woo was one of the quieter aces in baseball last year. His 0.93 WHIP for the Mariners came alongside a 2.94 ERA, 186.2 innings, and an All-Star nod. On July 10, he carried a no-hitter into the 8th inning against the Yankees. When a pitcher allows fewer than one baserunner per inning as a baseline, a no-hit bid isn’t a fluke. It’s the logical extreme of working clean.
Those benchmarks apply to starters. Relievers tend to post lower WHIPs because they pitch fewer innings against targeted matchups. Chapman’s 0.70 and Josh Hader’s 0.85 (for Houston, before a shoulder injury ended his year) are elite even by reliever standards, but comparing them directly to a starter’s WHIP over 190 innings isn’t quite apples to apples.
Get daily baseball updates, free
Scores, recaps, standings and Vibe Checks every morning.
Why WHIP Is a Bullpen Decoder
Every broadcast puts ERA next to a pitcher’s name. Almost none show WHIP. For starters working 6 or 7 innings, that’s a defensible choice. But for relievers pitching one inning at a time, I think WHIP is the more useful number. And it gets almost zero screen time.
A reliever’s entire job is to get outs without letting runners reach base. That’s what WHIP measures. Directly.
We send out 30 team digests every morning at Small Ball, and building those newsletters really drove home how a pairing of ERA and WHIP tells a pitcher’s story more honestly than either stat alone. WHIP especially opens up your understanding of bullpen arms who need to limit baserunners in short stints on the mound. A reliever with a 2.50 ERA and a 1.40 WHIP is surviving, not dominating.
The traffic catches up.
Look at Chapman’s 2025 next to Tanner Scott’s with the Dodgers. Chapman: 0.70 WHIP, 1.17 ERA, 32 saves. Scott: 1.26 WHIP, 4.74 ERA, 23 saves but 10 blown saves.
ERA already tells you Chapman was better. WHIP explains the mechanism. Chapman allowed fewer than one baserunner per inning he pitched. Scott was putting runners on in practically every appearance, and the baserunners eventually scored.
Hader landed between them at 0.85 WHIP and a 2.05 ERA for Houston, recording 28 saves before his shoulder gave out. His WHIP confirmed what the ERA suggested: clean innings, not narrow escapes. If you can only look at two numbers to evaluate a bullpen arm, skip the win-loss record entirely. ERA plus WHIP gives you both the outcome and the process.
Where WHIP Goes Blind
WHIP treats all baserunners the same. A walk and a double both count as one baserunner, but a double does far more damage. A pitcher who issues 10 walks in a week and a pitcher who surrenders 10 extra-base hits look identical by WHIP. They’re not remotely the same.
Hit batters, errors, and reached-on-fielder’s-choice don’t appear in the formula either. Those are smaller baserunner sources than walks and hits, but they’re invisible to WHIP.
The strikeout gap is the subtler problem. Two pitchers can carry identical WHIPs through completely different approaches. One throws strikes and lets contact happen, leaning on his defense to make plays. The other misses bats and racks up strikeouts. WHIP sees the same result if the same number of runners reach, but the pitcher who strikes batters out controls his own fate in a way the contact pitcher can’t. WAR at least attempts to contextualize individual contributions within a team framework. WHIP doesn’t try.
And every pitching stat shares this blind spot: WHIP measures one arm at a time. A starter with a brilliant 1.00 WHIP who hands the ball to a bullpen sitting at 1.40 creates a different game than the same starter backed by a pen at 1.05.
The way innings connect, the confidence a starter carries knowing his bullpen won’t leak the lead, the looseness a closer pitches with when his team’s been scoring eight runs a night. Those forces don’t live in any individual stat line. They’re the connective tissue of a pitching staff, and they’re what Vibe Check tracks: collective team momentum as it flows across a full game, not frozen in one pitcher’s column.
Pitching Stats, Delivered Before First Pitch
Small Ball’s daily newsletter tracks every arm on your team’s staff, including the numbers broadcasts skip. ERA, WHIP, matchup trends, and Vibe Check, all in your inbox every morning. Pick your team and subscribe free.

 Arizona Diamondbacks
 Atlanta Braves
 Baltimore Orioles
 Boston Red Sox
 Chicago Cubs
 Chicago White Sox
 Cincinnati Reds
 Cleveland Guardians
 Colorado Rockies
 Detroit Tigers
 Houston Astros
 Kansas City Royals
 Los Angeles Angels
 Los Angeles Dodgers
 Miami Marlins
 Milwaukee Brewers
 Minnesota Twins
 New York Mets
 New York Yankees
 Oakland Athletics
 Philadelphia Phillies
 Pittsburgh Pirates
 San Diego Padres
 San Francisco Giants
 Seattle Mariners
 St. Louis Cardinals
 Tampa Bay Rays
 Texas Rangers
 Toronto Blue Jays
 Washington Nationals