In late May 2024, the Royals' Bobby Witt Jr. was hitting .329 with a BABIP north of .380. Meanwhile, the Mets' Pete Alonso was slugging away with a .198 BABIP that made his batting line look like he'd forgotten how to hit. One guy was running hot. The other was running cold. And if you're wondering what is BABIP in baseball, it's the thermometer that told you exactly how much of each guy's story was real.
If you've ever looked at a hitter's stat line and thought "there's no way this holds up" or "he's way better than these numbers," you were already thinking about BABIP without knowing it. So let's make it official.
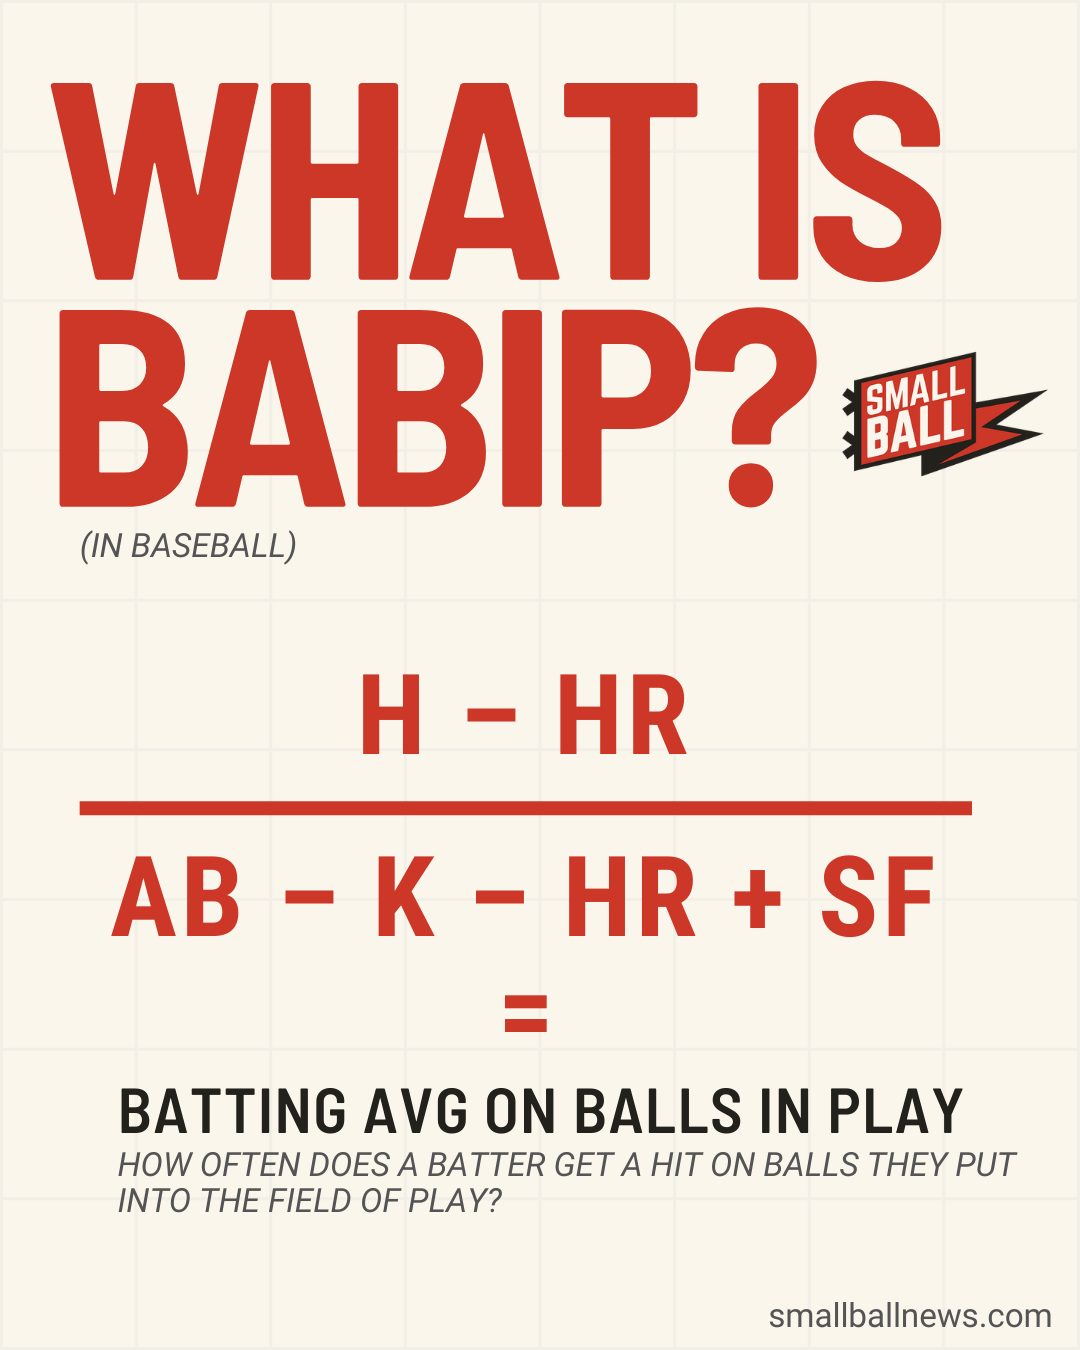
What Is BABIP in Baseball, Exactly?
BABIP stands for Batting Average on Balls in Play. It measures how often a batter gets a hit on balls they put into the field of play, stripping out strikeouts, walks, hit-by-pitches, and home runs. Those outcomes are removed because they don't involve the defense at all. A strikeout is between the pitcher and hitter. A home run clears the fence.
What's left is every batted ball that a fielder could have caught or could have missed. Ground balls that sneak through the infield. Line drives that find gaps. Fly balls that drop in front of an outfielder.
Once a ball is in play, a huge amount of randomness enters the picture. Where the fielders are standing, how hard the wind is blowing, whether the shortstop got a good jump. Some of that is skill. A lot of it is luck, which is why understanding BABIP luck vs skill is so important for evaluating players honestly.
The BABIP Formula (Simpler Than It Looks)
Here's how BABIP is calculated:
BABIP = (H - HR) / (AB - K - HR + SF)
Let's walk through it with a real example. Say a hitter has these season numbers:
- 160 hits (H)
- 30 home runs (HR)
- 500 at-bats (AB)
- 120 strikeouts (K)
- 5 sacrifice flies (SF)
Plug those in:
(160 - 30) / (500 - 120 - 30 + 5) = 130 / 355 = .366 BABIP
That's above average, which might mean the hitter is genuinely elite at putting the ball where fielders aren't, or it might mean he's been getting lucky on batted balls. The answer is almost always some combination of both.
The formula works for pitchers too. A pitcher's BABIP tells you how often balls hit against them fell for hits. Pitchers have even less control over BABIP than hitters do, which is why it's one of the first places analysts look when a pitcher's ERA seems too good or too bad to be true.
What Counts as a Good BABIP in Baseball?
The league-average BABIP has hovered around .300 for decades. That number is remarkably stable year to year, which is part of why BABIP is so useful as a diagnostic tool.
Here are the general benchmarks:
| BABIP Range | What It Means | Example (2024) |
|---|---|---|
| .340+ | Running hot, elite contact skill, or both | Bobby Witt Jr. (.357) |
| .310 - .340 | Slightly above average; sustainable for good hitters | Marcell Ozuna (.322) |
| .290 - .310 | League average range | Most MLB regulars |
| .260 - .290 | Running cold or poor contact quality | Pete Alonso (.261 in May '24) |
| Below .260 | Almost certainly unlucky; regression coming | Struggling hitters early in a season |
A few important caveats on those tiers. Speed matters. Fast runners like Elly De La Cruz can sustain higher BABIPs because they beat out infield grounders that would be outs for slower players. Line-drive rate matters too. Hitters who consistently barrel the ball will carry higher BABIPs over time because line drives fall for hits at a much higher rate than fly balls or grounders.
So a good BABIP in baseball isn't purely about luck. But the luck component is enormous, especially over small samples.
Why BABIP Is a Fantasy Baseball Weapon
Here's where BABIP becomes a weapon rather than just a number.
If you play fantasy baseball, BABIP is one of the single best tools for identifying buy-low and sell-high candidates. The logic is straightforward. A hitter with a .220 BABIP in April is almost certainly going to see that number climb toward .300 as the season progresses. His batting average will rise with it. If you can trade for him while his line looks ugly, you're buying a stock at a discount.
The reverse is true for a hitter riding a .380 BABIP with no track record of sustaining it. His numbers look incredible right now. They won't last.
I think BABIP fantasy baseball analysis is the single most underused edge in casual leagues. Most managers react to batting average and RBIs. The ones who look underneath those numbers at BABIP, line-drive rate, and hard-hit percentage are the ones making trades that look lopsided in June and genius by September.
Context matters, though. You can't just sort a leaderboard by BABIP and assume every low number will bounce back. A hitter who changed his swing, came back from injury, or lost bat speed might genuinely be worse. BABIP tells you to ask the question. It doesn't always answer it.
For a deeper look at how underlying metrics separate real changes from noise, check out our breakdown of what FIP tells you that ERA doesn't.
Get daily baseball updates, free
Scores, recaps, standings and Vibe Checks every morning.
Where BABIP Falls Short
BABIP is excellent at one thing: flagging when a player's results don't match their underlying quality of contact. It's the stat that whispers "this probably won't continue" when everyone else is either panicking or celebrating.
But it has real blind spots.
It doesn't account for exit velocity or launch angle. A hitter who consistently smokes the ball at 105 mph should have a higher BABIP than a hitter who makes weak contact. BABIP treats all balls in play the same, whether it's a 110-mph line drive or a 72-mph nubber. Metrics like expected batting average (xBA) from Statcast do a better job of capturing contact quality.
It doesn't care about defensive positioning. The shift era (before MLB's 2023 rule changes) showed how much defensive alignment could suppress BABIP for pull-heavy hitters. Even now, teams position their fielders differently based on spray charts, and BABIP doesn't adjust for any of it.
It flattens timing and context. A .300 BABIP over a full season is one thing. But what if a hitter had a .220 BABIP in April and a .380 BABIP in August? The season-long number looks perfectly normal, but the lived experience was a two-month nightmare followed by a heater.
I've tracked BABIP across all 30 team digests for months now, and it's one of the numbers that tells you the least about what's actually happening in a clubhouse.
The Momentum That BABIP Can't Measure
Think about the 2023 Diamondbacks. They made the World Series as a wild card team that nobody expected to be there. Their BABIP during that October run was solid but not extraordinary.
What was extraordinary was the momentum.
The dugout energy. The way every broken-bat single and bloop hit felt like it carried more weight because the team believed something was happening. BABIP would tell you they got some hits. It wouldn't tell you that those hits came in clusters during moments that mattered, or that the team's collective confidence was feeding on itself in a way that made the next hit more likely.
That's the gap we built the Small Ball Vibe Check score to address. It tracks momentum, streaks, and collective energy across all 30 teams, every day. Not as a replacement for BABIP or any other stat, but as the layer that sits on top of them. Because two teams can have identical BABIPs and completely different trajectories, and if you're only looking at the numbers, you'll miss why.
BABIP tells you a hitter might be getting lucky. Vibe Check tells you whether that luck is riding a wave that's still building or one that's about to crash.
Get the Full Picture, Every Morning
Want BABIP context alongside momentum tracking for your favorite team? Small Ball's daily newsletters break down what the numbers say and what the vibes say for all 30 clubs. Pick your team and get the digest that actually matches what you're seeing when you watch the games.
 Arizona Diamondbacks
 Atlanta Braves
 Baltimore Orioles
 Boston Red Sox
 Chicago Cubs
 Chicago White Sox
 Cincinnati Reds
 Cleveland Guardians
 Colorado Rockies
 Detroit Tigers
 Houston Astros
 Kansas City Royals
 Los Angeles Angels
 Los Angeles Dodgers
 Miami Marlins
 Milwaukee Brewers
 Minnesota Twins
 New York Mets
 New York Yankees
 Oakland Athletics
 Philadelphia Phillies
 Pittsburgh Pirates
 San Diego Padres
 San Francisco Giants
 Seattle Mariners
 St. Louis Cardinals
 Tampa Bay Rays
 Texas Rangers
 Toronto Blue Jays
 Washington Nationals