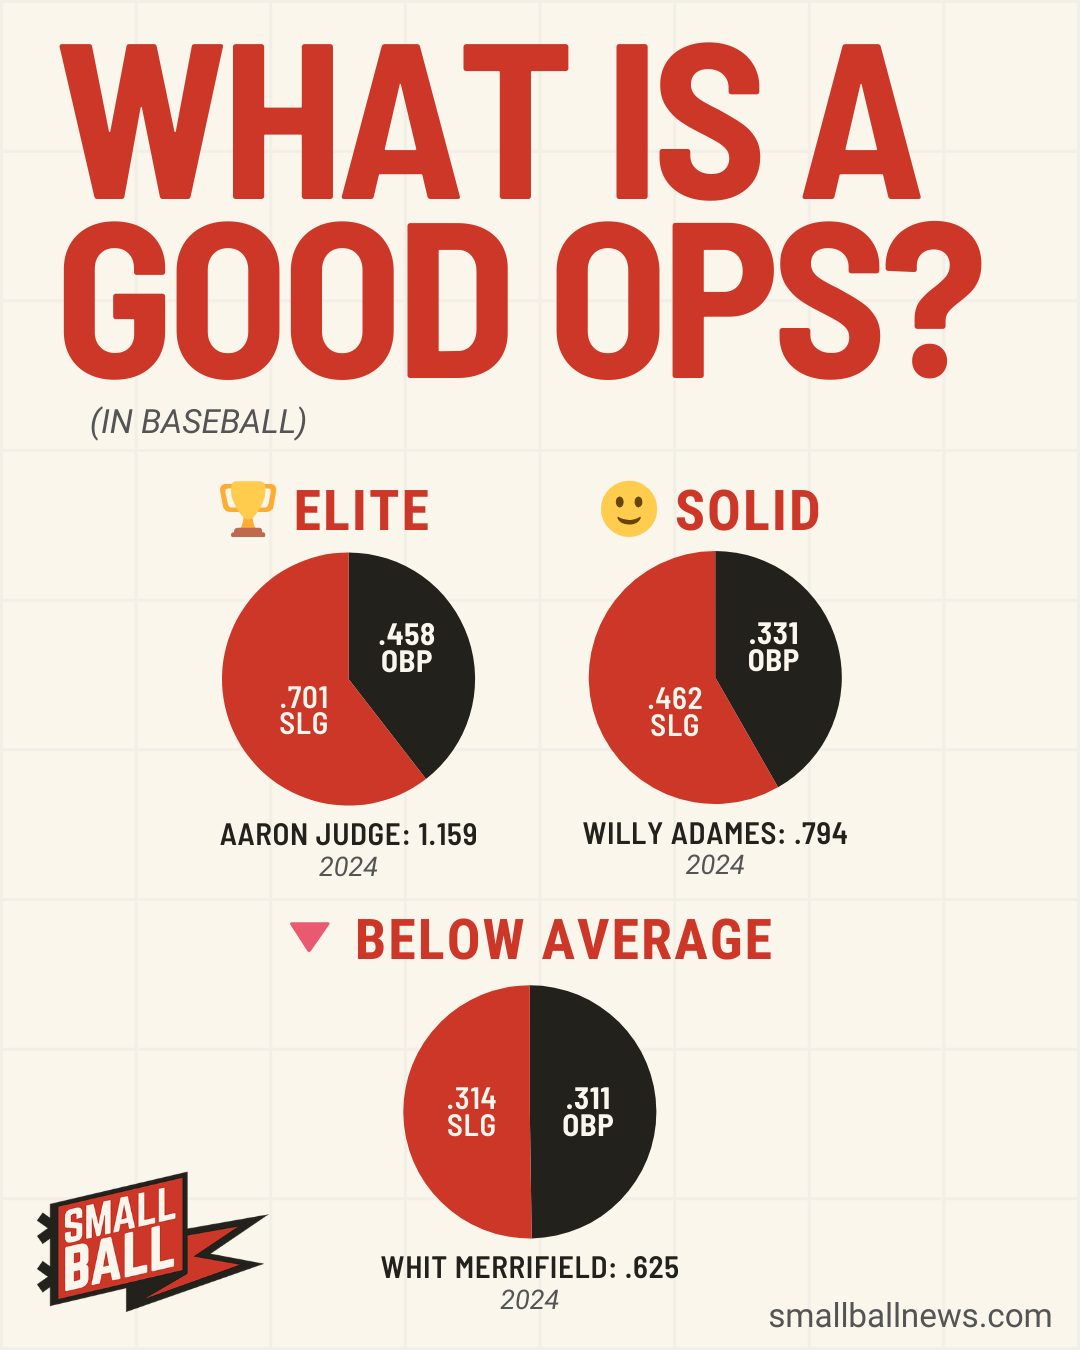
Cal Raleigh posted a .948 OPS for the Seattle Mariners in 2025. Excellent number for any hitter. Borderline historic for a catcher.
The standard answer to what is a good OPS in baseball is .800. It's not wrong. But it's incomplete.
League average OPS at catcher was .694 in 2025. Raleigh beat that positional average by 254 points, hit 32 home runs, and carried a 202 OPS+ that belongs in the same sentence as Barry Bonds' early-MVP seasons. He did all of it while squatting behind home plate for 120 games.
That .800 threshold works as a starting point. Where it falls apart is when you apply it uniformly across positions, eras, and contexts. An .800 OPS from a designated hitter is barely above average for the position. The same .800 from a catcher makes you one of the best hitting backstops in baseball.
What Counts as a Good OPS?
If you're not familiar with OPS, it combines on-base percentage and slugging percentage into one number. Higher is better. League-wide OPS in 2025 was .719 (per Baseball Reference), and the .800 line remains the threshold most analysts use for "good."
| OPS | What It Means | 2025 Examples |
|---|---|---|
| 1.000+ | MVP-caliber, historically rare | Aaron Judge (1.144), Shohei Ohtani (1.014), Nick Kurtz (1.002) |
| .900-.999 | All-Star, legitimate star | George Springer (.959), Cal Raleigh (.948), Juan Soto (.921) |
| .800-.899 | Above average, solid everyday player | Bobby Witt Jr. (.852), Bryce Harper (.844) |
| .720-.799 | League average | Where most everyday starters sit |
| .650-.719 | Below average | Defense-first players earning their spot |
| Under .650 | Poor | Replacement-level offense |
Three players broke 1.000 OPS in 2025. Aaron Judge at 1.144 was in a league of his own. Shohei Ohtani hit 1.014 while leading the Dodgers to a World Series championship. And Nick Kurtz, Oakland's 22-year-old first baseman, posted 1.002 with 36 home runs to win unanimous Rookie of the Year.
On July 25, Kurtz became the first rookie in MLB history to hit four home runs in a single game, going 6-for-6.
George Springer's .959 might have been the most surprising number on the board. In 2024, he posted a career-low 91 OPS+ with Toronto. Written off at 35. Then he came back with a .309 average, 32 homers, and an OPS that ranked fourth in all of baseball.
In October, he hit a go-ahead three-run homer in Game 7 of the ALCS to send the Blue Jays to the World Series for the first time since 1993.
Same player. Same age. A 250-point OPS swing in twelve months.
A Good OPS Depends on Where You Play
General benchmarks are useful, but they hide something critical: position matters enormously when you're evaluating OPS. The offensive expectations shift dramatically across the diamond, and if you're not adjusting for position, you're misreading most of the lineup.
Here's where each position actually landed in 2025:
| Position | Avg OPS (2025) |
|---|---|
| DH | .784 |
| 1B | .750 |
| RF | .741 |
| LF | .723 |
| SS | .718 |
| 3B | .701 |
| C | .694 |
| CF | .691 |
| 2B | .689 |
The spread from designated hitter (.784) to second base (.689) is nearly 100 points. A second baseman posting .770 is as far above his positional average as a DH posting .860. Both are producing roughly 80 points above their peers. Both are equally valuable with the bat relative to what their position demands.
Raw OPS benchmarks miss this entirely.
Bobby Witt Jr. posted .852 from shortstop for Kansas City. Solid number by any standard. But shortstops averaged .718, which means Witt was 134 points above the positional average, making him one of the most valuable offensive shortstops in baseball.
A first baseman at .852 would be just 102 points above the 1B average. Witt's number is worth more, in context, because he's producing from a position where offense is harder to find.
After tracking daily stat digests across all 30 teams, positional context is one of the first things I check now. An .810 OPS from a catcher tells a completely different story than an .810 from a first baseman, even though the number on the stat sheet looks identical. The catcher is an offensive weapon at his position. The first baseman is barely above average for his.
That distinction doesn't show up in the general benchmarks table. I think it should.
Get daily baseball updates, free
Scores, recaps, standings and Vibe Checks every morning.
What .800 Meant in 2000 vs. 2025
The benchmarks also shift over time. League average OPS in 2000 was .782 during the steroid era's peak. An .800 OPS that year was barely above average. In 2025, with the league sitting at .719, the same .800 separates you from the pack by 81 points.
In 2025, the Yankees led all teams with a .787 team OPS. The Dodgers won the World Series with a .768. The gap between the best offensive team in baseball and the league average was only 68 points.
That's how compressed the offensive environment has become. Velocity keeps climbing, spin rates keep rising, and the margin between good and average keeps shrinking.
The Disconnect Between Good OPS and Winning
I think OPS is the single best quick-read stat for evaluating a hitter. Better than batting average alone, more accessible than wOBA or wRC+. One number, two dimensions of offense, instantly useful. If I can only look at one stat, it's OPS.
But we've been tracking a daily Vibe Check score across all 30 teams at Small Ball, and one of the most consistent patterns in the data is this: team OPS and actual outcomes diverge constantly. A lineup full of .800 OPS hitters will score three runs one week and eight the next. Season numbers could look the same across multiple teams, but they could be experiencing a completely different energy.
The 2025 Blue Jays were a perfect case. Their team OPS ranked middle of the pack for most of the regular season. Nothing in the numbers suggested a World Series run.
Then October arrived, Springer started crushing everything, the lineup fed off his energy, and they rode a collective surge to Game 7 of the World Series. OPS said they were decent. The games said they were dangerous. Our Vibe Check tracked that shift in real time, catching the momentum weeks before the stat line reflected it.
OPS in Context, Every Morning
Small Ball's free daily newsletter delivers your team's offensive numbers with the positional context and Vibe Check score that raw OPS alone can't provide. Pick your team and subscribe.
 Arizona Diamondbacks
 Atlanta Braves
 Baltimore Orioles
 Boston Red Sox
 Chicago Cubs
 Chicago White Sox
 Cincinnati Reds
 Cleveland Guardians
 Colorado Rockies
 Detroit Tigers
 Houston Astros
 Kansas City Royals
 Los Angeles Angels
 Los Angeles Dodgers
 Miami Marlins
 Milwaukee Brewers
 Minnesota Twins
 New York Mets
 New York Yankees
 Oakland Athletics
 Philadelphia Phillies
 Pittsburgh Pirates
 San Diego Padres
 San Francisco Giants
 Seattle Mariners
 St. Louis Cardinals
 Tampa Bay Rays
 Texas Rangers
 Toronto Blue Jays
 Washington Nationals