In 2024, Javier Báez hit .184 for the Tigers. The worst batting average among qualified hitters in the American League. The Athletic called his contract the worst in the sport.
Then he had hip surgery, moved eight inches up in the batter’s box, and came back in 2025 hitting .254 with a career-low whiff rate. Seventy points of batting average, reclaimed by standing in a slightly different spot.
That swing from .184 to .254 tells you something about what a good batting average means. It may be far more volatile and rely much more on comparison than most fans realize.
What Batting Average Measures
Batting average is one of the simplest stats in baseball. It answers one question: how often does this hitter get a hit?
Batting Average = Hits / At-Bats
That’s it. No weighting for extra-base hits, no credit for walks or hit-by-pitches, no penalty for strikeouts versus groundouts. A bloop single and a 450-foot homer count the same. A walk doesn’t count at all.
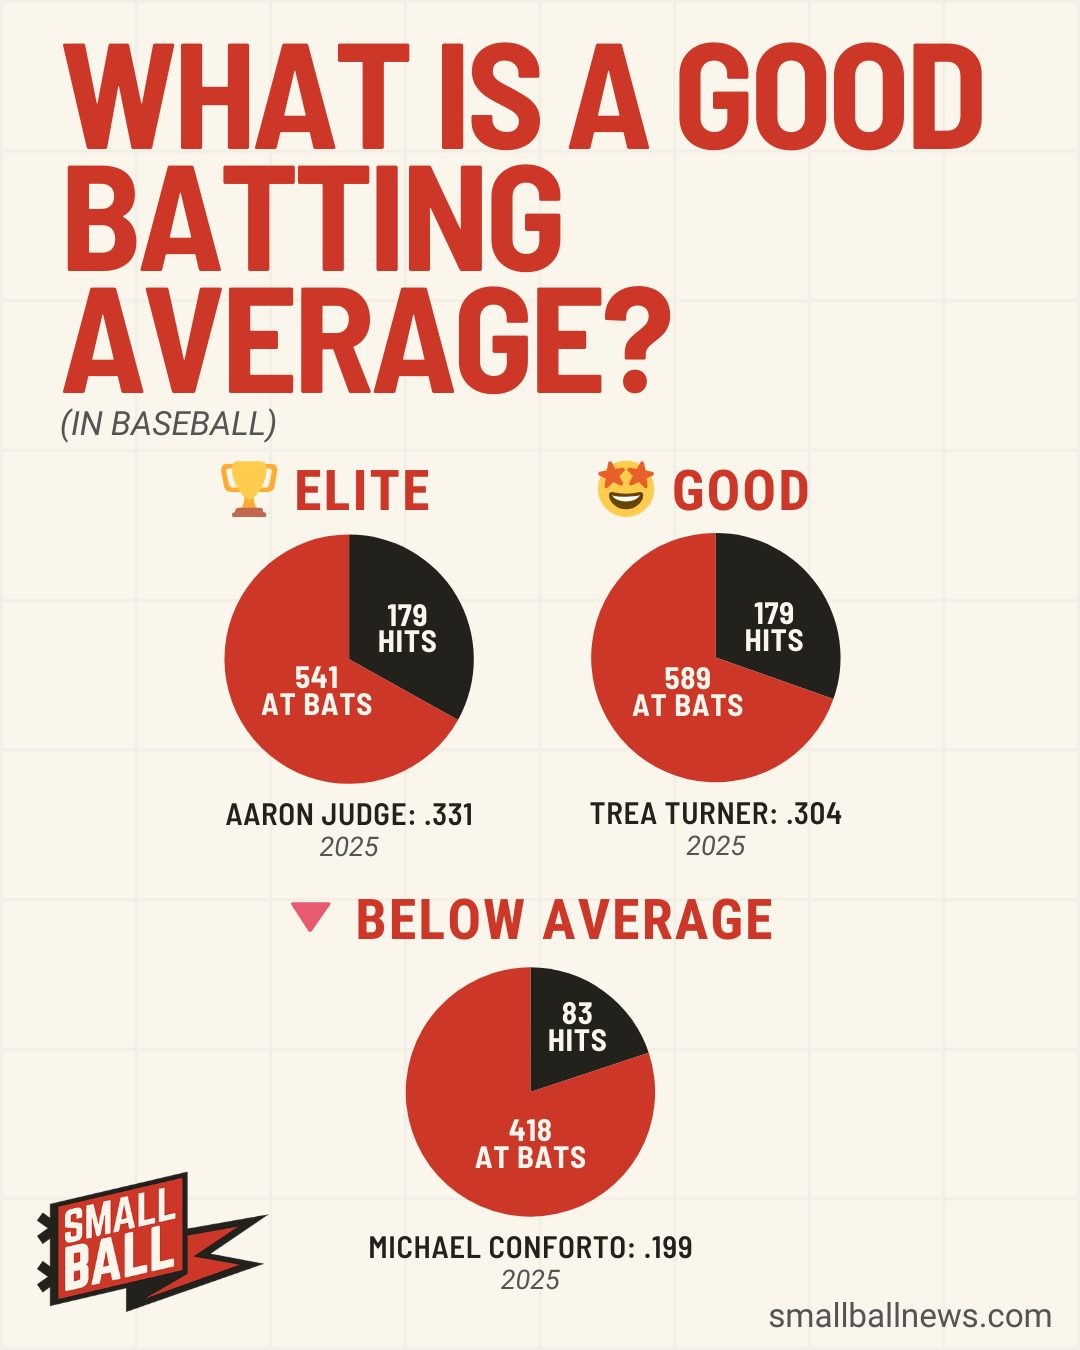
Aaron Judge won the 2025 AL batting title with a .331 average: 179 hits in 541 at-bats. Every time Judge stepped up to the plate, there was about a 1 in 3 chance that he would put the ball in play. It was a big average for a big guy... Incidentatlly, at 6-foot-7, he became the tallest batting champion in MLB history.
What Counts as a Good Batting Average?
A good batting average has meant different things across different eras of baseball. In 2000, the league hit .270. In 2025, it hit .245. The bar has moved, and if you’re still using benchmarks from the steroid era, you’re grading on a curve that doesn’t exist anymore.
Here’s where the numbers actually sit in today’s game:
| Batting Average | What It Means | 2025 Examples |
|---|---|---|
| .330+ | MVP-caliber, historically elite | Aaron Judge (.331) |
| .300-.329 | All-Star, batting title contender | Bo Bichette (.311), Trea Turner (.304) |
| .280-.299 | Above average, consistent producer | Freddie Freeman (.295), Bobby Witt Jr. (.295) |
| .250-.279 | League average | Where most everyday starters land |
| .230-.249 | Below average | Playable if the player has power or walks |
| Under .230 | Struggling | A problem for anyone without elite defense |
Trea Turner won the NL batting title at .304. That’s the lowest NL-winning average since the dead-ball era, and it tells you everything about where offense sits right now. Hitting .300 used to make you one of many. In 2025, it made you a batting champion.
How Batting Average Has Shifted
The decade-by-decade trend tells a clear story. Batting average has been falling for twenty years, and it’s not coming back.
| Era | League AVG | What Was Happening |
|---|---|---|
| 1930 | .296 | Live ball era, tiny ballparks, no relief specialists |
| 1950 | .266 | Integration, better pitching depth |
| 1968 | .237 | Year of the Pitcher (MLB lowered the mound after this) |
| 1980 | .265 | Power renaissance beginning |
| 2000 | .270 | Steroid era peak, juiced balls, small strike zones |
| 2010 | .257 | Post-steroid correction |
| 2019 | .252 | Last “normal” season before shifts and spider tack |
| 2023 | .248 | Shift ban boosted average slightly |
| 2025 | .245 | Velocity arms race, expanding strike zones |
The important thing isn’t any single year. It’s the direction. League average in 2025 was .245, which means the typical MLB hitter fails to get a hit roughly three out of every four at-bats. What counts as a good batting average keeps falling. A .250 hitter, once considered mediocre, is now dead average.
Get daily baseball updates, free
Scores, recaps, standings and Vibe Checks every morning.
What 70 Points Actually Takes
This is the part that doesn’t show up in the benchmarks table, and it’s the part I find most interesting about batting average. The number looks stable on a stat sheet, sitting there with three clean decimal places... sometimes used to describe an entire offensive career. But underneath, it’s constantly moving.
Báez’s story is the extreme version. In 2024, he was functionally unplayable: .184 batting average, .516 OPS, a whiff rate over 30%, chasing pitches out of the zone at one of the highest rates in the league. The Tigers announced hip surgery in August. Most people assumed his career was over.
Then spring training 2025. Báez moved eight inches higher in the batter’s box, changing where he made contact with the ball. He started intercepting pitches 10.1 inches in front of the plate, one of the furthest contact points in baseball.
His chase rate dropped to 40.6%, the second-lowest of his career. His whiff rate fell to 28.1%, a career best. When asked what changed, Báez talked about working on his timing, understanding “what works for individual hitters.”
Those adjustments weren’t dramatic. Eight inches. A slightly earlier swing. Laying off a few more pitches out of the zone.
The result was a jump from .184 to .254: from worst hitter in baseball to functional everyday player. Small mechanical changes producing huge swings in the number.
After tracking daily stat digests across all 30 teams, this is one of the patterns that stands out to me most: a player’s batting average can look completely different month to month based on changes you’d never see from the box score. A new stance, a different grip, a week of facing left-handed pitching. The number moves, and it doesn’t always tell you why.
Julio Rodríguez is the other version of this. His batting average reliably jumps 30 to 40 points after the All-Star break, every single year of his career. In the first half of 2025, he hit .207 through April. By September, he was one of the most dangerous hitters in the American League.
Same player. Same swing, mostly. His wRC+ (Weighted Runs Created Plus) went from 109 in the first half to 146 in the second. Something just clicks for him when the weather turns, and his lift in batting average is what shows it most clearly, even if it can’t explain it.
What Batting Average Doesn’t Tell You
For all its simplicity, batting average has real blind spots, and I think they’re significant enough that you shouldn’t evaluate a hitter on batting average alone. Ever.
Walks are invisible. A hitter who works a full count and draws a walk has done something valuable. He’s on base. He wore down the pitcher. He extended the inning. Batting average doesn’t count it. Doesn’t even acknowledge it happened. Juan Soto built a Hall of Fame career partly on elite plate discipline, and batting average has always undersold him.
Power vanishes. A single and a home run are the same hit. A guy who hits .270 with 40 homers and a guy who hits .270 with 2 homers look identical by batting average. They are not remotely the same hitter.
Batting average also ignores how outs are made. A groundout that advances a runner from second to third is more valuable than a strikeout that doesn’t. Batting average treats them identically: both are at-bats without a hit.
That’s why stats like OPS and WAR exist. They fill the gaps batting average leaves. But there’s one gap even those stats can’t fill.
The Vibes Behind the Numbers
The analytics community spent a solid decade arguing that vibes aren’t real. That you can’t measure team energy. That momentum is a myth invented by broadcasters and debunked by sample sizes.
Then the 2023 Diamondbacks went to the World Series. Nobody’s models predicted that. Then the 2024 Royals won 86 games after losing 106 the year before. The underlying numbers didn’t justify a 20-win improvement that fast.
Something was operating in those clubhouses that batting average, OPS, and WAR couldn’t capture. The same force that makes a lineup suddenly start hitting in the same week after a month-long slump, or that turns a .240 team into a .270 team for a three-week stretch when everything just feels right.
The vibes were real. They were always real. Traditional stats just didn’t have a way to measure them.
The Small Ball Vibe Check does. It tracks team momentum across hitting, pitching, and defense as it shifts day to day, not flattened into a season-long average. The kind of energy that turns a .240 hitter into a .290 hitter for three weeks, or a struggling lineup into an unstoppable one.
See Where Your Team’s Average Stands
Small Ball’s free daily newsletter tracks your team’s hitting, pitching, and Vibe Check score every morning. Real numbers with the context batting average alone can’t give you. Pick your team and start getting it.
 Arizona Diamondbacks
 Atlanta Braves
 Baltimore Orioles
 Boston Red Sox
 Chicago Cubs
 Chicago White Sox
 Cincinnati Reds
 Cleveland Guardians
 Colorado Rockies
 Detroit Tigers
 Houston Astros
 Kansas City Royals
 Los Angeles Angels
 Los Angeles Dodgers
 Miami Marlins
 Milwaukee Brewers
 Minnesota Twins
 New York Mets
 New York Yankees
 Oakland Athletics
 Philadelphia Phillies
 Pittsburgh Pirates
 San Diego Padres
 San Francisco Giants
 Seattle Mariners
 St. Louis Cardinals
 Tampa Bay Rays
 Texas Rangers
 Toronto Blue Jays
 Washington Nationals